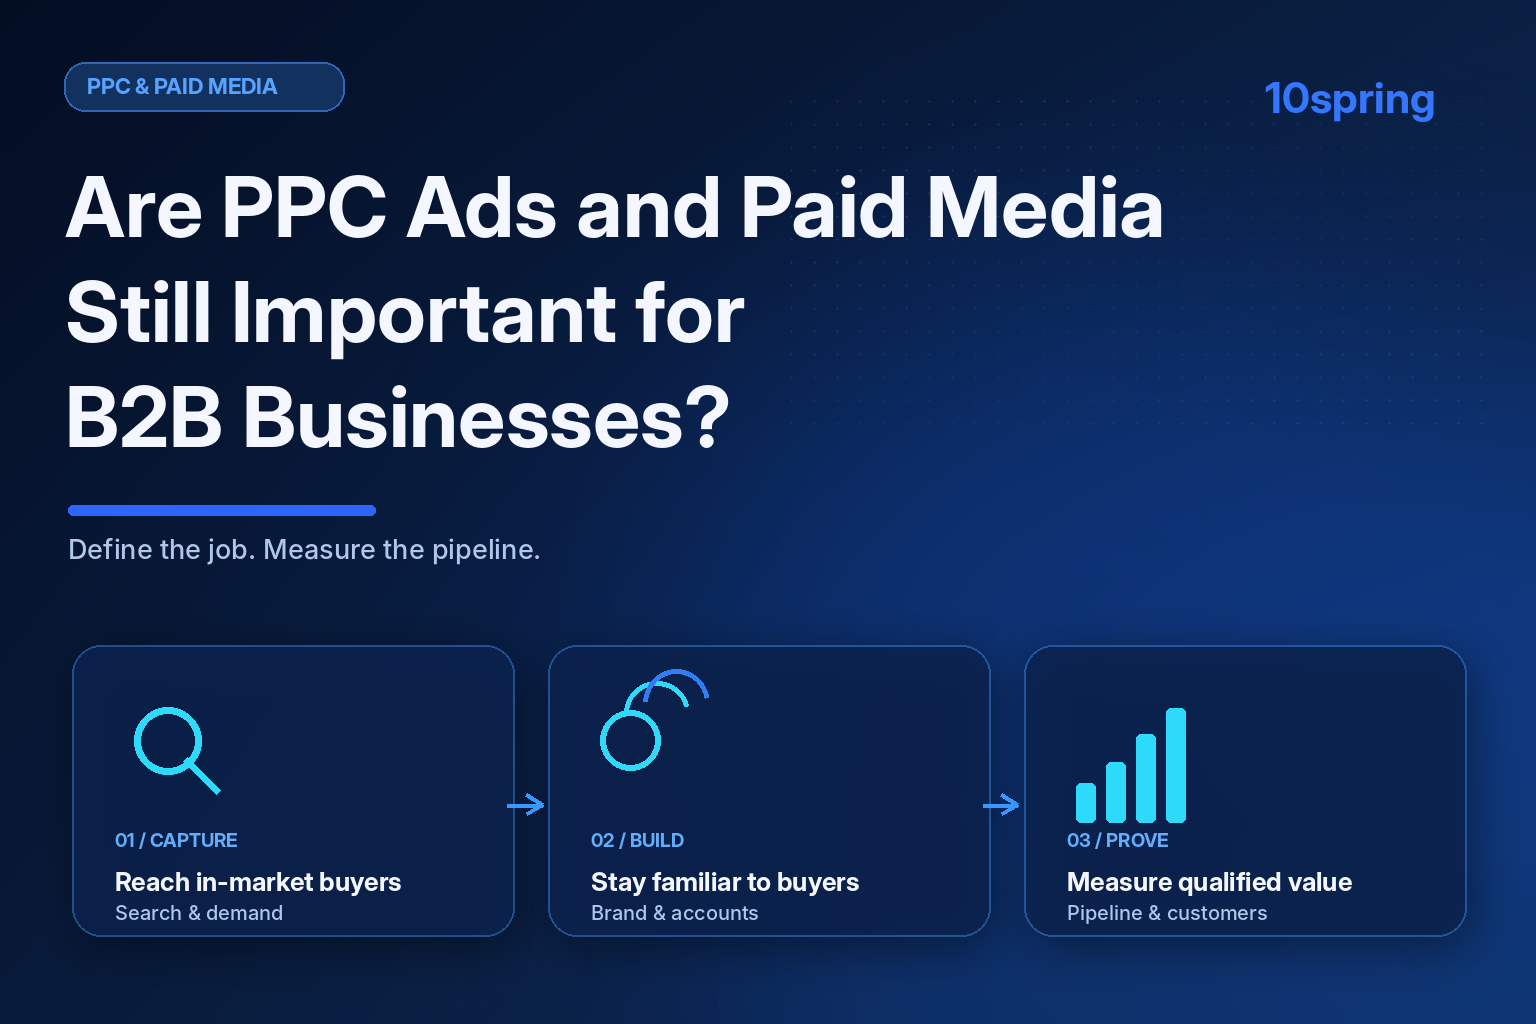
Two claims about paid media circulate in B2B marketing at the same time. One says ads are the fastest way to reach buyers who are ready to buy, and that budgets are rising for good reason. The other says buyers form their shortlists before they click anything, so ads mostly pay for demand that would have arrived anyway. Both claims contain something true, which is why the question deserves a careful answer.
This article asks whether PPC ads and paid media are still important for B2B businesses. The short answer is yes, for specific jobs, and only when diagnosis supports the role. It then explains what paid media does in B2B and why the question is sharper now. After that it reviews what the evidence supports and where it is thin, when spend earns its place, and how to measure it against pipeline.
It draws on Gartner's 2026 CMO Spend Survey, research from the Ehrenberg-Bass Institute and LinkedIn's B2B Institute, a Forrester analysis, a peer-reviewed field experiment, and benchmark reports from Dreamdata, Metadata, and WordStream. Several of those sources sell advertising software or services, so the article notes where the evidence has limits. It reflects what was published as of November 16, 2026.
The short answer
Paid media is still important for many B2B businesses. It is not important in the way a platform dashboard usually implies, and it is not a default answer to every growth problem.
- Yes, for defined jobs. Paid media can reach buyers who are looking now, keep a brand familiar to buyers who are not, and support programs aimed at named accounts. It also gives fast feedback on messages and offers.
- No, as a standalone fix. Ads send people into a conversion path. If positioning is unclear, the website cannot convert, or sales cannot work the opportunities, more spend amplifies the leak. That is an inference.
- Not on platform numbers alone. Click-through rate, cost per click, and cost per lead are useful diagnostics. They do not prove that spend produced qualified opportunities, pipeline, or customers.
- Yes, when diagnosis supports the role. The right amount, mix, and timing depend on the size of the in-market audience, the state of the conversion path, and the length of the sales cycle.
The rest of this article explains why those four statements hold.
What paid media does in B2B
Paid media is often discussed as one thing. In B2B it does at least four different jobs, and each job has a different test of success.
- Capture demand that already exists. Search ads and some LinkedIn formats reach buyers who are actively looking. Professor John Dawes of the Ehrenberg-Bass Institute notes that acquisition in any period is capped by the number of buyers who are in the market. Success looks like qualified opportunities at an acceptable cost.
- Build memory with buyers who are not buying yet. Dawes argues that most people who see an ad are not buying soon, so advertising mainly builds memory links to the brand that activate when they enter the market. Success looks like familiarity and shortlist presence, and it shows up later and indirectly.
- Support programs aimed at named accounts. Paid media can put a message in front of several members of a buying group at once. Dreamdata's customer data show about 10 stakeholders per deal, which is why reaching one contact is rarely enough. Success looks like engagement across the account and opportunities created in target accounts.
- Test messages and offers quickly. Paid channels return feedback in days, which can show which problem statements and offers earn attention before a team commits to larger programs. That is an inference. Success looks like a decision, not a click.
Keeping the jobs separate prevents a common mistake. A search campaign built to capture demand gets judged on awareness, or a reach campaign gets judged on last-click form fills, and the program looks like a failure for the wrong reason.
Why the question is sharper now
Three developments make the question harder to answer from habit.
Budgets are moving toward paid media. Chief Marketer's summary of Gartner's 2026 CMO Spend Survey reports that paid media reached a five-year high of 31.4% of the mean marketing budget, up from 25.1% in 2021. It also reports that 53% of respondents planned to invest more in paid media while 25% expected to cut spend. Gartner's press release says the survey ran from January through March 2026 among 401 chief marketing officers (CMOs) and other marketing leaders in North America, the United Kingdom, and Europe. The excerpts reviewed do not separate B2B from consumer companies. Chief Marketer links the rise to the adoption of AI for targeting and automated bidding, but its summary does not clearly attribute that explanation to Gartner.
A bigger budget share shows where leaders are putting money. It does not show what works. In the same press release, Gartner reported that awareness and conversion now account for 62.6% of total media spend, while loyalty and retention fell to less than 15%. It added that the most AI-mature organizations allocate more to retention and less to digital channels. Gartner said that suggests less mature organizations may be "over-indexing on short-term optimization." That is Gartner's interpretation, not a measured result.
Buyers shortlist before they contact sellers. 6sense's 2025 Buyer Experience study, which combined two surveys totaling more than 4,000 responses, reports that 95% of the time the winning vendor was already on the Day One shortlist. It also reports that four out of five deals are won by the vendor at the top of the shortlist before seller engagement. MarTech's summary of a G2 report says AI chatbots are now the top source influencing shortlists at 54%, ahead of software review sites at 43% and vendor sites at 36%. 6sense sells software for account-based programs and buyer intent data. G2 runs a software review marketplace, and its sample is software buyers.
If the shortlist forms before a buyer clicks an ad, ads that appear only at the moment of comparison lose value, and being known and recommended earlier gains value. That is an inference. It applies most clearly in categories where buyers already research in AI chat before they visit vendor sites.
Journeys are long and crowded. Dreamdata's 2026 report, built on its customers' data from August 2024 to July 2025, puts the average customer journey at 272 days, up from 211. PPC Land's coverage adds that 81% of the journey occurs before pipeline begins, with about 88 touchpoints and 10 stakeholders per deal. Dreamdata sells B2B attribution software, and its customers may differ from the wider market. A journey this long and this crowded makes any single click a thin basis for credit. That is an inference.
Together, these developments do not say paid media matters less. They say its role needs to be defined more precisely, and its results need to be read against a longer timeline.
How many B2B buyers are in the market at any time
The most cited idea in this debate is the 95-5 rule. It comes from a May 2021 report by Professor John Dawes of the Ehrenberg-Bass Institute, summarized on the Institute's research page. The logic is simple. Corporations switch key providers, such as a principal bank or law firm, about once every five years on average. On a five-year cycle, about 20% of business buyers are in the market over a full year and about 5% in any given quarter.
Dawes calls the 95% a heuristic, not a precise rule, and says it depends on the category's purchase cycle. His worked example shows the sensitivity. On a two-year cycle, about half of buyers are in the market over a year and about 13% in any quarter. He suggests surveying buyers on how often they purchase to find the figure for a specific category. LinkedIn's B2B Institute has helped spread the rule, and LinkedIn sells advertising, which is worth remembering when reading how it is repackaged.
Other analysts have tested the idea against their own data. In May 2025, Forrester principal analyst John Arnold wrote that 5% is too low for the B2B marketing technology categories Forrester tracks. He reports that about 20% of B2B organizations plan to change their primary provider in such a category, and that 78% of them plan to do so within 12 months. That works out to about 15.6% in market each year, and he suggests assuming 15% to 30% of an audience is in market for those categories. The page does not describe a sample size or survey method.
The two sets of numbers are closer than the headlines suggest. Dawes's annual figure for a five-year cycle is about 20%, and Arnold's annual figure is about 15.6%. The apparent gap comes from comparing a 12-month window with a quarterly one. That is an inference, and the Forrester page does not make that comparison itself. A May 2026 webinar page from The Insight Collective makes a related argument that the rule fits fast-growing B2B technology categories poorly.
The practical lesson is to estimate the in-market share for your own category before setting targets for lead capture. A category with a long, infrequent purchase cycle has few buyers in market at once, so search and lead-capture ads run out of volume sooner. A category with a faster cycle has more. That is an inference.
How brand and activation spend balance
A second body of evidence asks how much to spend on building the brand versus driving an immediate response. LinkedIn's B2B Institute commissioned Les Binet and Peter Field, whose earlier work covers consumer marketing, to analyze B2B campaigns. LinkedIn's October 2019 summary states that B2B businesses grow best with about 46% of budget on brand building and 54% on activation. It describes activation as marketing aimed at the most likely immediate buyers. WARC's report on the research says the data came from confidential material submitted with entries to the IPA effectiveness awards.
The finding has limits that readers should weigh.
- The sample is award entries. Campaigns entered in an effectiveness competition may skew toward successes. That is an inference.
- The pattern is an association. Observational data of this kind cannot show that the split caused the growth. That is an inference.
- The sponsor sells advertising. LinkedIn commissioned the research, and its summary page does not state any limitations.
A split between brand and activation is also not a split between channels. Paid media can serve both, so the finding says more about what the spend is for than about which platform to use. The sensible use is as a starting hypothesis to test against your own pipeline data, not as a target. That is an inference.
Dawes's report adds two practical points. Spread advertising across the year rather than concentrating it in one quarter, which leaves the brand absent for the rest of the year. And test whether the advertising builds brand-relevant memories, which he treats as the key question. He also argues that targeting only people who are searching leaves a brand less familiar and limits long-term growth, and that building familiarity is a multi-year task.
What platform benchmarks show
Benchmarks are the most abundant evidence and the weakest. Three recent sources show why.
Dreamdata's LinkedIn Ads Benchmarks Report 2026 analyzed aggregated data from its customers, covering more than 66 million sessions and 3.5 million customer journeys. It reports return on ad spend (ROAS), which compares attributed revenue with ad spend, of 121% for LinkedIn, 67% for Google Search, and 51% for Meta. The prior edition reported 113% for LinkedIn, 78% for Google Search, and 29% for Meta. PPC Land's coverage adds that LinkedIn influenced 36% of new-business deals, Google Search 31%, and Meta 2%. For a subset of customers defined by percentile, Dreamdata reports 279% for LinkedIn, 138% for Google Search, and 133% for Meta.
Several limits apply.
- The data come from one vendor's customers. Companies that buy attribution software may differ from the wider market.
- ROAS depends on the attribution model. With a 272-day average journey, spend late in the data window had little time to produce revenue. That is an inference, and the sources reviewed do not say how Dreamdata handled it.
- Methods changed. PPC Land reports that company-level cost figures are not like-for-like with last year because Dreamdata introduced a new method for resolving website visits to companies.
- Total spend is not given. Without it, the share of budget behind each figure cannot be judged.
- The vendor has an interest. Dreamdata sells attribution and is a LinkedIn Marketing Partner.
Dreamdata also treats cost per contact influenced as a limited measure for B2B. That cost rose on all three platforms, but winning a deal means reaching a buying committee, not an individual. Read carefully, the report supports a narrower claim than its headline. In this customer sample, LinkedIn's attributed revenue was higher relative to spend than Google Search's or Meta's. It does not show that any platform would have produced those results without the spend.
Cost-per-lead benchmarks differ even more. Metadata's 2026 benchmark covers 153 B2B advertisers that ran 57.6 million dollars of paid media through its platform in calendar 2025 and produced 211,000 leads. It reports a cost per lead of about 202 dollars on LinkedIn, 145 dollars on Facebook, 138 dollars on Instagram, and 524 dollars on Google Ads. Metadata also says the LinkedIn figure is spend-weighted and that the middle of the market paid 376 dollars. WordStream and LocaliQ's 2026 benchmarks draw on 13,474 US search campaigns on Google and Microsoft Ads from April 2025 through March 2026. They report an all-industry median cost per lead of 66.69 dollars and 93.69 dollars for Business Services.
Metadata's Google Ads figure is more than five times the WordStream Business Services median. The gap is not a contradiction. The samples, the industries, the definitions of a lead, and the mix of campaign types all differ. WordStream's page does not explain how it counts leads, and Metadata's figures come from advertisers using its software, so neither allows a like-for-like comparison. Metadata sells software that automates B2B advertising, and WordStream and LocaliQ sell related services.
Metadata makes one point worth keeping. The cheapest leads and the cheapest customers often come from different channels, so a decision based on cost per lead alone can pick the wrong channel. Benchmarks are useful for spotting an outlier, such as a cost per lead far outside a peer range. They are poor targets. The relevant benchmark is your own cost per qualified opportunity, tracked over time. That is an inference.
What field experiments show about incrementality
Attribution tells you which ads were present before a purchase. It does not tell you what would have happened without them. Incrementality, meaning the extra outcomes the ads caused, needs an experiment.
The best-known test in paid search is a set of large-scale field experiments at eBay. Tom Blake, Chris Nosko, and Steven Tadelis published it as NBER Working Paper 20171 in May 2014 and in Econometrica in 2015. The authors found that paid search returns were only a fraction of conventional non-experimental estimates, because search clicks and purchases are correlated. Ads on brand keywords had no measurable short-term benefit. For non-brand keywords, new and infrequent users were positively influenced. Frequent users, whose purchases the ads did not influence, accounted for most of the expense, so average returns were negative.
The study has clear limits. The setting was a consumer marketplace, and the data are about a decade old. It is not a B2B finding. It matters for a different reason: it shows that the people who click an ad are often the people already likely to buy. Brand-term search and retargeting, which reach people who already know the company, are where that problem is most likely to inflate reported results. That is an inference. The sources reviewed did not include a comparable B2B field experiment, and this article did not review independent evidence on retargeting in B2B.
What the evidence adds up to
Taken together, the evidence supports a measured conclusion.
- Paid media has real jobs in B2B. Research on buyer timing and brand memory gives a coherent reason to use it both to capture demand and to stay familiar.
- Reported performance is mostly vendor data. Dreamdata, Metadata, WordStream, 6sense, G2, and LinkedIn each sell something related to what they measure. Their figures are worth reading, and none should be treated as a target.
- Independent B2B evidence on incrementality is thin. The strongest experimental evidence reviewed comes from a consumer marketplace.
- The case rests on mechanism and your own data. Whether paid media earns its place in a given company depends on its in-market audience, its conversion path, and its measured cost per qualified opportunity. That is an inference.
That is why the right question is not whether paid media works in B2B in general. The right question is what job it is doing for this company, and whether the data show it doing that job.
When paid media earns its place
These conditions tend to make paid media worth funding. They are inferences from the evidence above, not findings from a single study.
- There is enough in-market demand to capture. Category and problem-based search terms have volume, and the purchase cycle is short enough that a meaningful share of the market buys each period.
- The audience can be defined and reached. Target accounts and roles can be identified in the ad platforms in use, and the message speaks to them specifically.
- The conversion path works. Landing pages load quickly, forms are short, tracking records the right events, routing is tested, and sales follows up fast. Otherwise spend leaks.
- The sales cycle and contract value support the cost. At realistic win rates, the cost per qualified opportunity leaves room after sales costs.
- Measurement reaches the CRM. Qualified opportunities and closed deals flow back to the ad platforms, so optimization targets pipeline and not form fills.
- The brand is not yet familiar. Dawes reports that lesser-known brands have lower consideration and click-through rates. A less familiar company has more to gain from sustained exposure and more to lose from relying on clicks alone.
- A question needs a fast answer. Testing positioning, offers, and segments before building larger programs is a job paid media can do quickly.
When paid media does not earn its place
The same evidence points to situations where spend is likely to disappoint.
- The in-market audience is very small. If few buyers purchase in any quarter and search volume is thin, lead-capture campaigns run out of volume, and added budget raises cost without adding opportunities.
- The conversion path is broken. If the site does not convert, follow-up is slow, or sales cannot work the leads, ads add cost to a leak. Diagnose first.
- There is no agreed definition of qualified. Without one, optimization drifts toward cheap form fills, and Metadata's point about leads and customers applies.
- Paid media is covering for weak positioning. If buyers cannot tell why the company is different, ads buy attention that does not convert.
- Reported results rest on brand terms and retargeting. Those audiences already know the company, so reported performance may overstate what the spend added. Test before scaling.
- Spend is too thin or too stop-start to build familiarity. Dawes argues that building mental availability takes sustained spend over years. A small budget concentrated in short bursts is better judged as demand capture than as brand building.
Cutting paid media can also be a mistake, particularly when the cut rests only on last-click reports. That is another reason to base the decision on an incrementality test, not a hunch. All of the points in these two lists are inferences.
How to measure paid media against pipeline
Platform reports describe activity. Pipeline describes outcomes. A revenue-first view keeps them in order and uses three layers.
- Layer 1: activity and infrastructure signals. Impressions, reach among target accounts, click-through rate, cost per click, tracking health, and whether qualified outcomes are sent back to the ad platforms. Use them to diagnose the campaign, not to judge the program.
- Layer 2: conversion performance. Lead-to-opportunity rate by campaign, qualified opportunities created, cost per qualified opportunity, and speed of follow-up. This is where the conversion path either works or does not.
- Layer 3: business impact. Pipeline, new customers, and recurring revenue, attributed only where reliable data supports it. Allow for the length of the sales cycle before judging.
Five practices keep the layers honest.
- Baseline first. Record conversion rates, cycle length, and cost per qualified opportunity before changing spend or structure, so improvement can be shown.
- Compare over quarters. With journeys averaging 272 days in Dreamdata's sample, a few weeks of data say little about pipeline. Metadata's data likewise do not support plans that assume ad spend pays for itself within a year. Metadata could match revenue to CRM records for 127 of its 153 advertisers.
- Test incrementality where budget allows. Pause or hold out brand-term and retargeting spend in matched regions or account groups, then compare qualified opportunities. B2B volumes are small, so expect longer test windows. That is an inference.
- Ask buyers how they found you. Add a buyer-reported source field to forms and sales notes. Platform data miss private research in AI Search Engines and conversations that never produce a click. That is an inference.
- State the attribution limits. Paid media influences pipeline alongside sales, content, search, and market conditions. No model gives exact credit, so report ranges and say what the model cannot see.
If activity rises without qualified opportunities, diagnose the conversion pathway before adding more spend. Look at audience fit, message, landing page, form, routing, follow-up speed, and qualification criteria. Those are the first places to look.
Where paid media fits among the nine Execution Channels
Paid media works best when the channels around it are in place and the data connect them.
- PPC & Paid Media. Targeted paid programs earn their place when diagnosis supports a clear role for them, and they are judged on qualified opportunities and pipeline.
- GTM Strategy. Segments, ideal customer definitions, and positioning decide who the ads reach and what they say.
- Account-Based Marketing. Named-account lists let paid media reach the buying group, and account-level reporting shows whether it did.
- AI Search Readiness + SEO. Organic visibility and paid search often compete for the same queries, and presence in AI Search Engines shapes shortlists before any ad is seen. The first part is an inference.
- Content Development. Ads need substantive pages and assets that answer buyer questions at each stage.
- Digital PR. Earned mentions build the familiarity that ads draw on. They are hard to attribute, so buyer-reported source helps.
- Website Development. Speed, tracking, forms, and CRM integration decide whether a click reaches the pipeline intact.
- Conversion Rate Optimization (CRO). Landing pages and forms are where paid traffic converts or leaks, and testing shows where the friction sits.
- RevOps. Definitions, routing, and CRM data show what the spend produced. Sending qualified outcomes back to ad platforms lets them optimize toward pipeline.
10spring treats PPC & Paid Media as one of nine Execution Channels that work together. Its role is set by diagnosis, and its value is judged on the pipeline it helps create.
Practical takeaways
- Define the job before funding it. Name whether the spend is meant to capture demand, build familiarity, support named accounts, or test messages, and set a different success test for each.
- Estimate your own in-market share. Published estimates use different time windows and categories, so check your category's purchase cycle.
- Treat budget trends as context, not proof. A rising share of budget for paid media shows where leaders are putting money, not what works.
- Treat benchmarks as vendor data. Use them to spot outliers, and set targets from your own cost per qualified opportunity.
- Diagnose the conversion path before adding spend. Fix audience fit, message, landing pages, tracking, routing, and follow-up first.
- Test incrementality for brand terms and retargeting. Audiences that already know the company may convert without ads, so check before scaling.
- Sustain familiarity-building spend across the year. Short bursts are better judged as demand capture than as brand building.
- Send qualified outcomes back to the platforms. Optimizing toward form fills trades quality for volume.
- Plan paid media with the other channels. Its results depend on the website, content, search visibility, and RevOps data around it.
- Judge in layers, over quarters. Use activity metrics as diagnostics, judge the program on qualified opportunities, pipeline, customers, and recurring revenue, and state the attribution limits.
10spring works alongside internal marketing teams. If you want to pressure-test what your paid media contributes to pipeline, Book A Call. Let's accelerate your pipeline together.
Sources and further reading
All sources accessed November 16, 2026.
- Chief Marketer. Gartner CMO Spend Survey: Budgets Reflect Increase in Consumption-Based Martech, Paid Media Spend. Trade article, June 24, 2026, summarizing Gartner's 2026 CMO Spend Survey. Used for the 31.4% and 25.1% paid media shares and the shares planning to invest more or cut. The article links the rise to AI adoption but does not clearly attribute that explanation to Gartner. Fieldwork dates are not stated in the article.
- Gartner. Gartner Marketing Survey Finds Awareness and Conversion Account for 62.6% of Total Media Spend. Press release distributed by Business Wire, June 8, 2026. Read through search excerpts only. Used for the survey scope, the 62.6% share, the decline in loyalty and retention spend, and the comment on AI-mature organizations. Gartner sells research and advisory services.
- Ehrenberg-Bass Institute, by Professor John Dawes. Advertising effectiveness and the 95-5 rule: most B2B buyers are not in the market right now. Research report page, May 2021. Used for how the 95% figure is derived, how advertising works according to the report, and its recommendations. The author calls the figure a heuristic that depends on the category's purchase cycle. The rule has been widely repackaged, including by LinkedIn's B2B Institute, and LinkedIn sells advertising.
- Forrester, by John Arnold. The 95-5 Rule Is Not A Rule, But It's Not A Myth Either. Analyst blog post, May 12, 2025. Used for the estimated in-market share in B2B marketing technology categories. The page does not describe sample size or survey method and covers only the categories it names. Forrester sells research and advisory services.
- The Insight Collective. Rising Markets Break the 95:5 Rule. Webinar series page, May 28, 2026. Read through a search excerpt only. Used for the argument that the rule fits fast-growing technology categories poorly. The excerpt reviewed does not describe the evidence behind the argument.
- LinkedIn. How B2B marketing really drives growth. Company blog post, October 16, 2019. Used for the 46% and 54% finding and the description of activation. LinkedIn commissioned the research through its B2B Institute and sells advertising. The page does not state limitations or name the dataset.
- WARC. Binet and Field: Effectiveness Lessons in B2B. Event report, read through a search excerpt only. The excerpt reviewed does not state a date. The title is descriptive. Used for the origin of the data in submissions to the IPA effectiveness awards.
- 6sense. Marketing in Europe: Executive Summary of the 2025 Buyer Experience Study. Vendor research page, read through a search excerpt only. The excerpt reviewed does not state a date. The title is descriptive. Used for the Day One shortlist figure, the share of deals won before seller engagement, and the sample of more than 4,000 responses. The page also gives separate European figures, which this article does not use. 6sense sells software for account-based programs and buyer intent data.
- MarTech. AI's shortlist is the new B2B battleground. Trade article, read through a search excerpt only. The excerpt reviewed does not state a date. Used for G2's figures on sources influencing shortlists, reported from G2's report on AI search and B2B software buying. The excerpt does not give the sample size. G2 runs a software review marketplace.
- Dreamdata. Announcing The 2026 LinkedIn Ads Benchmarks Report by Dreamdata. Vendor blog post, read through a search excerpt only. The excerpt reviewed does not state a date. Used for the return on ad spend figures, the prior-year comparison, and the percentile subset, which the excerpts describe inconsistently. Dreamdata sells attribution software and is a LinkedIn Marketing Partner.
- PPC Land. LinkedIn Ads Hit 121% ROAS as B2B Buyer Journeys Stretch to 272 Days. Trade news article, March 10, 2026, on Dreamdata's report. The title is descriptive. Used for the journey length, touchpoints, stakeholders, share of influenced deals, cost per contact, and the method change affecting company-level costs. Data are Dreamdata's customer data from August 2024 to July 2025.
- Metadata. B2B advertising benchmarks: CTR, CPC, CPM and cost per lead by channel. Vendor benchmark page. The page does not state a publication date, and the data cover calendar 2025. Used for the cost per lead figures and the point about leads and customers. The sample is advertisers that ran campaigns through Metadata. Metadata sells B2B advertising automation software.
- Metadata. Tactical Lessons From the 2026 B2B Benchmark. Vendor benchmark page, read through a search excerpt only. The excerpt reviewed does not state a date. The title is descriptive. Used for the spend-weighted LinkedIn figure and the figure for the middle of the market.
- Metadata. Payback Timing in the 2026 B2B Benchmark. Vendor benchmark page, read through a search excerpt only. The excerpt reviewed does not state a date. The title is descriptive. Used for the point that advertising paying for itself within a year is not supported by its data, and for the 127 advertisers with revenue matched to CRM records.
- WordStream by LocaliQ. 2026 Google Ads Benchmarks. Vendor benchmark report. The page does not state a publication date, and the data cover April 2025 through March 2026. The title is descriptive. Used for the all-industry and Business Services cost per lead figures. The averages are medians, the page does not explain how leads are counted, and the sample comes from LocaliQ's own customers. LocaliQ sells related services.
- Blake, Nosko, and Tadelis. Consumer Heterogeneity and Paid Search Effectiveness: A Large Scale Field Experiment. NBER working paper page, issued May 2014, with a journal version in Econometrica, volume 83, 2015, pages 155 to 174. Used for the eBay experiment results. Two authors worked at eBay Research Labs during the study. The setting was a consumer marketplace, and the data are older than most sources here.